Как организовать мониторинг процессов windows c помощью zabbix? Интересует способ узнать сколько процентов от общего ресурса процессора потребляет тот или иной процесс.
Версия Windows: Windows 10 pro 1909 x64 Версия zabbix сервера: 4.4.3 Способ снятия метрик: активный агент
Вопрос задан более года назад
1211 просмотров
1.открываем perfmon.msc (не перепутайте с perfmon.exe — это немного другая программа.) 2.в «системном мониторе» (сейчас под рукой руссифицированная ось, поэтому ищите аналогичное на английском, благо монитор по умолчанию там один) нажимаем «добавить счетчики» 3. выбираем Process и ваш процесс, нужные метрики. Все это только для понимания «что» вы будете мониторить. теперь «как»: идем и внимательно читаем: https://www.zabbix.com/documentation/4.2/ru/manual. https://www.zabbix.com/documentation/4.2/ru/manual. В последней статье ищем proc_info — это оно и есть Если есть какие то перфкаунтеры которых вы не нашли в заббикс — в 1й статье в конце есть как добавить нужные через user parameters
Почему perfcounters а не WMI? Потому что обращение к WMI — довольно дорогая операция, часто не позапрашиваешь (а если залезть в глубины того что доступно через WMI — выяснится что там те же перфкаунтеры, облагороженные и обогащенные) — частое обращение довольно сильно жрет CPU Почему не сторонняя программа? Потому что Win уже собирает данные процессов и основная задача — добраться до них
Zabbix: мониторим всё подряд (на примере Redis’а)
Zabbix — замечательный продукт для администраторов крупных программно-аппаратных комплексов. Он настолько хорош, что может использоваться не только крупным бизнесом, но и средне-малым бизнесом, и даже в pet -проекте. В общем, у меня есть небольшой опыт работы с Zabbix’ом и я смело могу рекомендовать его к использованию.
Правда я не могу сказать, что понимаю «философию Zabbix’а«. Несмотря на обширную подробную документацию на русском языке, мне было сложно погружаться в мир Zabbix’а — создавалось ощущение, что мы с разработчиками одни и те же вещи называем разными именами. Возможно потому, что Zabbix создавался админами для админов, а я всё-таки больше разработчик и пользователь.
Тем не менее, для запуска Zabbix’а и для мониторинга основных параметров компьютерных систем (процессор, память и т.п.) навыков обычного linux-пользователя хватает. Есть большое количество плагинов от сторонних разработчиков, расширяющих возможности Zabbix’а. Для моих нужд мне потребовалось настроить мониторинг Redis-сервера. Я немного покопался в коде имеющихся плагинов и на их примере выяснил, что архитектура Zabbix’а позволяет достаточно просто подключать к мониторингу любые параметры информационных систем, которые могут быть выражены в числовом виде.
Под катом — пример Zabbix-плагина с моим пояснением по терминологии Zabbix’а. Кому-то этот пример покажется наивным, ну а кому-то поможет проще освоиться с понятиями. В любом случае, Zabbix достаточно велик для того, чтобы ощупать его с разных сторон.
Базовые понятия
Кратко о некоторых понятиях, которые используются в Zabbix’е: agents, items, triggers, actions, notifications, templates.
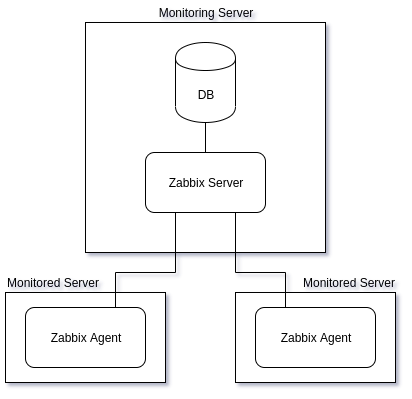
Сервер и агенты
С точки зрения пользователя Zabbix делится на две большие части: сервер и агенты. Сервер располагается на одной машине, которая собирает и хранит статистические данные, а агенты — на тех машинах, данные с которых собираются:
Параметры мониторинга
Любая величина, которая может выражена в числовом или строковом виде, называется в терминологии Zabbix’а — элементом данных (item). Каждый элемент связывается с уникальным ключом (именем). Вот примеры элементов данных:
system.cpu.load[percpu,avg1]: 0.1167
system.uname: «Linux supru 4.15.0-50-generic #54-Ubuntu SMP Mon May 6 18:46:08 UTC 2019 x86_64»
Значения этих элементов данных (параметров мониторинга) привязываются ко времени, история значений параметров сохраняется в базе сервера.
События
При наступлении некоторого события в Zabbix’е срабатывает триггер. Например,
>10 — среднее значение параметра за последние 5 минут превысило «10»
>0 — текущее значение параметра не равно предыдущему значению
По сути, триггеры — это формулы, в которых переменными выступают параметры мониторинга (текущие и сохранённые), и которые на выходе дают true / false .
Действия и Оповещения
В случае наступления события (срабатывания тригера) сервер может выполнить действие. Например, отправить оповещение по email’у на заданный адрес («Problem: host is unreachable for 5 minutes«). Также действие может быть выполнено в случае возвращения триггера в исходное состояние («Resolved: host is unreachable for 5 minutes«). Все события (переключения триггера) логируются на стороне сервера.
Шаблоны
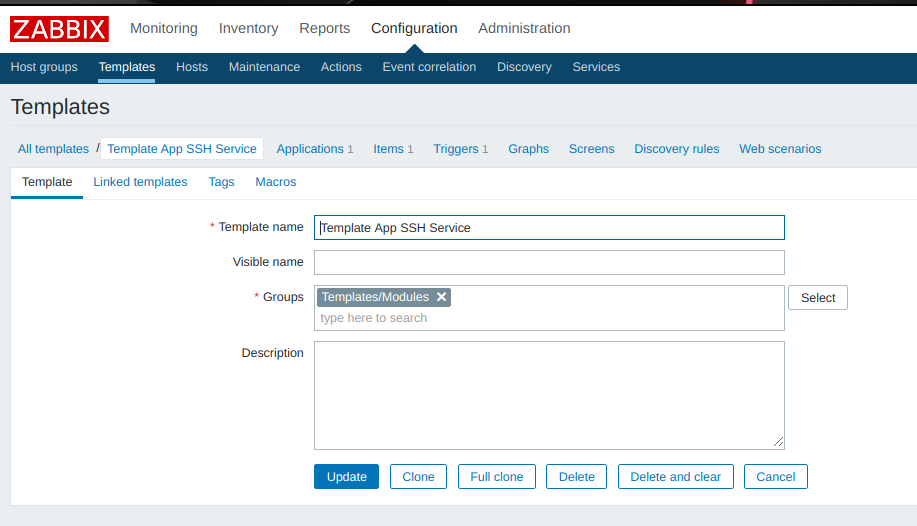
Zabbix даёт возможность как настроить правила мониторинга для отдельного хоста, так и создать шаблон правил (template), который можно применять к различным хостам:
На примере видно, что шаблон «Template App SSH Service» описывает одно приложение (Applications), один параметр мониторинга (Items), один триггер (Triggers). Также доступны описания для графиков, экранов, правил обнаружения и web-сценариев.
Постановка задачи для плагина
Начальное положение
Сам Zabbix предлагает свой собственный плагин для мониторинга состояния Redis’а, но на моей версии сервера (4.2.8) мне не удалось его задействовать (плагин для версии 4.4 и выше). Также предлагаются решения от третьих лиц (около десятка вариантов под различные версии Zabbix’а, на картинке только первых три):
Каждый из них обладал своими плюсами-минусами, пришлось заглянуть внутрь, чтобы выбрать. Лучшим, на мой взгляд, оказался плагин Shakeeljaveed/zabbix-redis-userparamaters, состоявший из двух файлов:
Немножко пришлось поработать «ручками», но зато на его примере стало чуть понятнее, как данные от агента попадают на сервер. По предложению автора Javeed Shakeel состояние Redis’а каждые 2 минуты сбрасывалось кроном в файл /tmp/redismetric :
А затем каждый параметр мониторинга извлекался агентом из файла /tmp/redismetric при помощи средств самой операционной системы. Инструкции для этого размещались в конфигурации Zabbix-агента /etc/zabbix/zabbix_agent.conf.d/userparameter_redis.conf . Например, вот так выглядят инструкция для извлечения параметра used_memory (использование памяти Redis-сервером):
То есть, в файле /tmp/redismetric с выводом redis-cli INFO по ключу used_memory ищется строка ( grep -w . )
которая затем разбивается на столбцы по разделителю «:» ( cut -d: -f2 ). На выходе агент получает число 7153216 и присваивает его параметру used_memory .
Остаётся через web-интерфейс настроить сервер, чтобы он периодически отправлял запросы агенту на получение данных по параметру used_memory , после чего данные начинают литься на сервер, сохраняться в базе, по ним можно строить графики и создавать триггера, реагирующие на изменения этого параметра.
Задачей мониторинга состояния любой системы явлется не только сбор статистики, но и предупреждение о возникновении ситуаций, требующих вмешательства человека. Так как с Redis’ом я работаю на уровне очень начинающего пользователя, то пришлось поискать информацию, на какие параметры «здоровья» обращать внимание и что они значат. Наиболее достойной показалась статья «6 Crucial Redis Monitoring Metrics You Need To Watch». Проанализировав её, я пришёл к выводу, что «для полного счастья» мне нужно собирать данные для обнаружения следующих событий:
Low cache hit ratio: (keyspace_hits)/ (keyspace_hits + keyspace_misses) 0
Evicted keys: evicted_keys > 0
Также я хотел собирать статистику по дополнительным параметрам (версия Redis’а, uptime и т.п.). В общем, имея общее представление о том, каким образом данные собираются агентом и передаются на сервер, «хотелки» можно сильно не ограничивать. В итоге получился список параметров для мониторинга из 12 позиций.
Создание собственного плагина
Параметры мониторинга
Плагин, который я анализировал, предполагал выполнение отдельной команды для получения отдельного параметра (элемента данных, item’а):
Т.е., для получения данных по 12 параметрам агент должен будет 12 раз выполнить различные наборы команд. А если мне нужно мониторить параметры, которые сложно извлечь цепочкой команд и нужно будет писать отдельный shell-скрипт или полноценную программу? Для таких «хотелок» Zabbix предлагает вариант с зависимыми элементами данных. Суть его в том, что на стороне агента скриптом формируется набор данных (например, в формате JSON), который передаётся на сервер в виде строкового параметра. Затем на стороне сервера происходит разбор полученных данных и вычленение из них отдельных элементарных параметров.
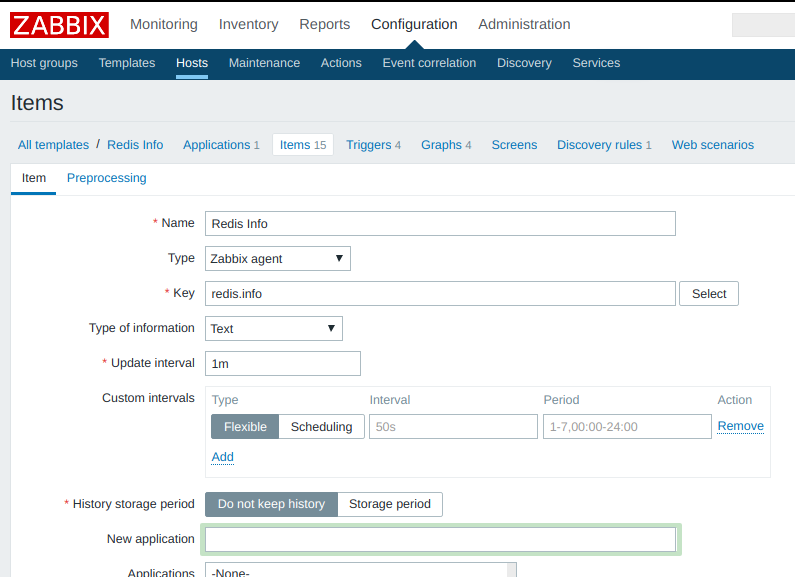
Основной элемент данных
Я описал основной элемент данных redis.info строкового типа с периодом обновления в 1 мин., без сохранения истории изменений:
Предположительно, на стороне агента должен генерироваться такой JSON:
после чего этот текст должен попадать на сервер в виде элемента данных redis.info , но не сохраняться, а служить базой для других элементов данных (параметров мониторинга).
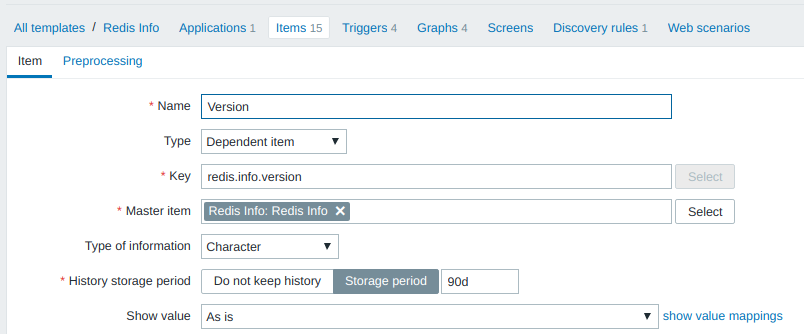
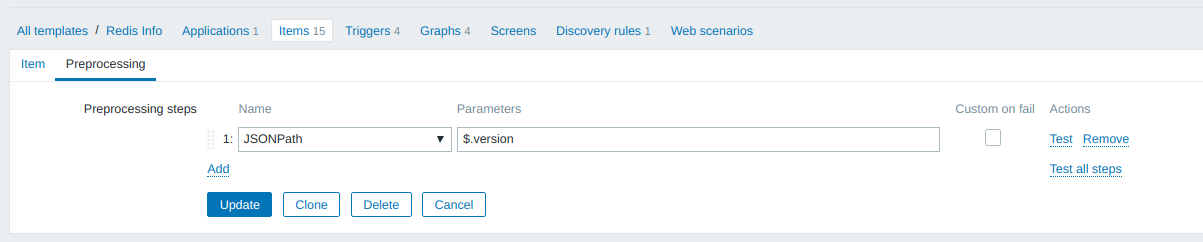
Зависимый элемент данных
Тестовый параметр redis.info.version зависит от redis.info и сохраняет свои значения в базе в течение 90 дней. Периодичность мониторинга параметра зависит от базового элемента ( redis.info ):
Значение параметра redis.info.version извлекается из значения redis.info при помощи инструкций JSONPath:
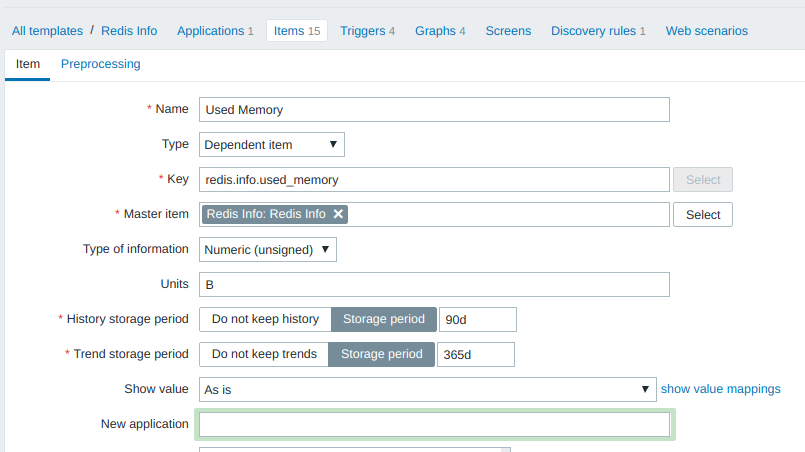
По аналогичной схеме описываются остальные зависимые элементы данных (параметры мониторинга), которые передаются в виде JSON’а. Вот пример описания числового параметра redis.info.used_memory :
Всё достаточно прозрачно, за исключением Units и Trend storage period . Со вторым пунктом я не разбирался, оставил по-умолчанию, а единицы измерения объяснены в документации. В данном случае значение redis.info.used_memory измеряется в байтах и в web-интерфейсе сворачивается до кило/мега/гига/. -байт.
Формула для извлечения значения из JSON’а: JSONPath = $.used_memory
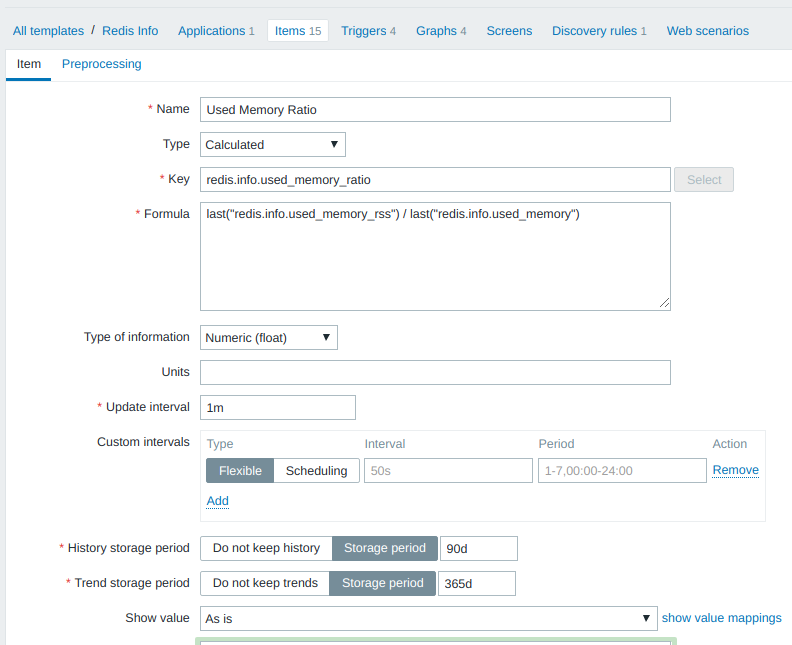
Вычисляемый элемент данных
Для вычисления фрагментации памяти используется отношение used_memory_rss / used_memory и на его базе определяется триггер, срабатывающий при превышении отношением значения 1.5. В Zabbix’е есть вычисляемый тип элементов данных:
Значение для параметра redis.info.used_memory_ratio вычисляется каждую минуту на основании последних значений двух других параметров ( redis.info.used_memory_rss и redis.info.used_memory ), сохраняется в базе в течение 90 дней и т.д.
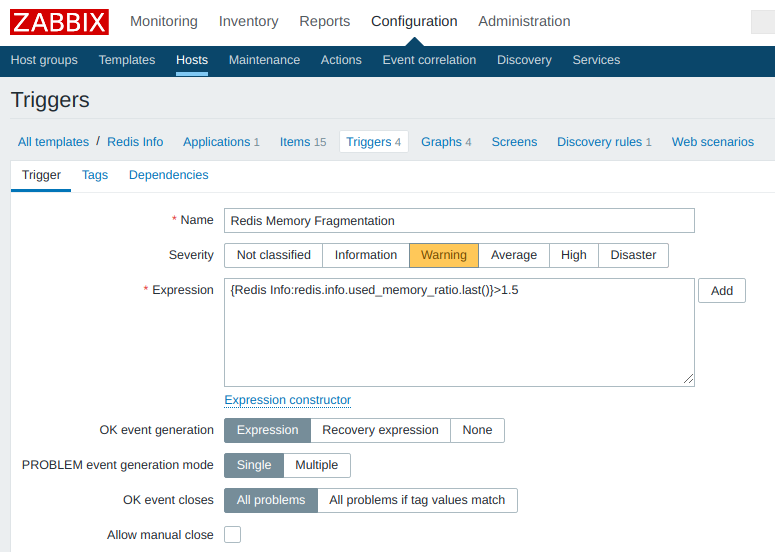
Триггеры
Вот пример триггера, срабатывающего при излишней фрагментации памяти:
Ничего необычного, за исключением формата выражений, используемого в формуле изменения состояния триггера. В Zabbix’е есть конструктор форм, можно воспользоваться им или обратиться к документации/примерам (список триггеров доступен через web-интерфейс по адресу «Configuration / Templates / $ / Triggers«).
Триггер может базироваться на любых элементах данных (item’ах) вне зависимости от их типа (основной, зависимый, вычисляемый).
Настройка агента
Генерация JSON’а
Для получения значений параметров мониторинга и формирования JSON’а я использую вот такой shell-скрипт:
Этот скрипт я поместил в файл /var/lib/zabbix/user_parameter/redis/get_info.sh на сервере с Redis’ом, на котором уже установлен агент Zabbix’а. Пользователь, под которым запускается Zabbix-агент (обычно zabbix ) должен иметь права на выполнение файла get_info.sh .
Файл userparameter_XXX.conf
На стороне агента дополнительные параметры мониторинга прописываются в файлах userparameter_*.conf в каталоге /etc/zabbix/zabbix_agentd.d . Поэтому для того, чтобы агент узнал о том, каким образом ему нужно собирать данные по параметру redis.info , я создал файл /etc/zabbix/zabbix_agentd.d/userparameter_redis.conf с таким содержимым:
Т.е., для получения данных по параметру redis.info агент должен запустить скрипт /var/lib/zabbix/user_parameter/redis/get_info.sh и передать на сервер результат выполнения.
После рестарта Zabbix-агента ( sudo service zabbix-agent restart ) у него появляется возможность собирать данные для параметра redis.info и отправлять их на сервер.
UPDATE: коллега banzayats обратил внимание, что текстовые данные с хоста можно получить без создания промежуточного скрипта userparameter_*.conf — при помощи параметра » system.run » и проводить постпроцессинг уже на стороне zabbix-сервера.
Резюме
Понимание Zabbix’а ко мне приходило (и всё ещё приходит) достаточно тяжело. Тем не менее я считаю его прекрасным инструментом, особенно после того, как для меня открылась простота добавления собственных параметров мониторинга (элементов данных). По большому счёту, достаточно добавить один файл на сервер с агентом ( userparameter_XXX.conf ) с shell-командой для сбора данных и настроить Zabbix-сервер на получение этих данных через web-интерфейс. И всё — можно накапливать данные, строить графики, анализировать изменения и создавать триггера, реагирующие на эти изменения.
Код шаблона, файла userparameter_redis.conf и скрипта get_info.sh можно посмотреть в проекте flancer32/zabbix_plugin_redis.
Спасибо всем, кто дочитал до конца, а особенно тем, кто нашёл в публикации что-то полезное для себя.
Zabbix + Windows
Windows
Microsoft Windows is a group of several graphical operating system families, all of which are developed, marketed, and sold by Microsoft.
Available solutions
Windows CPU by Zabbix agent
Overview
For Zabbix version: 5.4 and higher
Setup
Refer to the vendor documentation.
Zabbix configuration
No specific Zabbix configuration is required.
Macros used
The critical threshold of the % Interrupt Time counter.
The threshold of the % Privileged Time counter.
The threshold of the Processor Queue Length counter.
The critical threshold of the CPU utilization in %.
Template links
There are no template links in this template.
Discovery rules
Items collected
Group
Name
Description
Type
Key and additional info
CPU
CPU utilization
CPU utilization in %
ZABBIX_PASSIVE
system.cpu.util
CPU
CPU interrupt time
The Processor Information\% Interrupt Time is the time the processor spends receiving and servicing
hardware interrupts during sample intervals. This value is an indirect indicator of the activity of
devices that generate interrupts, such as the system clock, the mouse, disk drivers, data communication
lines, network interface cards and other peripheral devices. This is an easy way to identify a potential
hardware failure. This should never be higher than 20%.
Context Switches/sec is the combined rate at which all processors on the computer are switched from one thread to another.
Context switches occur when a running thread voluntarily relinquishes the processor, is preempted by a higher priority ready thread, or switches between user-mode and privileged (kernel) mode to use an Executive or subsystem service.
It is the sum of Thread\Context Switches/sec for all threads running on all processors in the computer and is measured in numbers of switches.
There are context switch counters on the System and Thread objects. This counter displays the difference between the values observed in the last two samples, divided by the duration of the sample interval.
ZABBIX_PASSIVE
perf_counter_en[«\System\Context Switches/sec»]
CPU
CPU privileged time
The Processor Information\% Privileged Time counter shows the percent of time that the processor is spent
executing in Kernel (or Privileged) mode. Privileged mode includes services interrupts inside Interrupt
Service Routines (ISRs), executing Deferred Procedure Calls (DPCs), Device Driver calls and other kernel-mode
The Processor Information\% User Time counter shows the percent of time that the processor(s) is spent executing
ZABBIX_PASSIVE
perf_counter_en[«\Processor Information(_total)\% User Time»]
CPU
Number of cores
The number of logical processors available on the computer.
ZABBIX_PASSIVE
wmi.get[root/cimv2,»Select NumberOfLogicalProcessors from Win32_ComputerSystem»]
CPU
CPU queue length
The Processor Queue Length shows the number of threads that are observed as delayed in the processor Ready Queue
and are waiting to be executed.
ZABBIX_PASSIVE
perf_counter_en[«\System\Processor Queue Length»]
Triggers
Name
Description
Expression
Severity
Dependencies and additional info
High CPU utilization (over <$CPU.UTIL.CRIT>% for 5m)
CPU utilization is too high. The system might be slow to respond.
>
WARNING
CPU interrupt time is too high (over <$CPU.INTERRUPT.CRIT.MAX>% for 5m)
«The CPU Interrupt Time in the last 5 minutes exceeds <$CPU.INTERRUPT.CRIT.MAX>%.»
The Processor Information\% Interrupt Time is the time the processor spends receiving and servicing
hardware interrupts during sample intervals. This value is an indirect indicator of the activity of
devices that generate interrupts, such as the system clock, the mouse, disk drivers, data communication
lines, network interface cards and other peripheral devices. This is an easy way to identify a potential
hardware failure. This should never be higher than 20%.
Depends on:
— High CPU utilization (over <$CPU.UTIL.CRIT>% for 5m)
CPU privileged time is too high (over <$CPU.PRIV.CRIT.MAX>% for 5m)
The CPU privileged time in the last 5 minutes exceeds <$CPU.PRIV.CRIT.MAX>%.
Depends on:
— CPU interrupt time is too high (over <$CPU.INTERRUPT.CRIT.MAX>% for 5m)
— High CPU utilization (over <$CPU.UTIL.CRIT>% for 5m)
CPU queue length is too high (over <$CPU.QUEUE.CRIT.MAX>for 5m)
The CPU Queue Length in the last 5 minutes exceeds <$CPU.QUEUE.CRIT.MAX>. According to actual observations, PQL should not exceed the number of cores * 2. To fine-tune the conditions, use the macro <$CPU.QUEUE.CRIT.MAX >.
Depends on:
— High CPU utilization (over <$CPU.UTIL.CRIT>% for 5m)
Feedback
Please report any issues with the template at https://support.zabbix.com
Windows memory by Zabbix agent
Overview
For Zabbix version: 5.4 and higher
Setup
Refer to the vendor documentation.
Zabbix configuration
No specific Zabbix configuration is required.
Macros used
The warning threshold of the Memory Pages/sec counter.
The warning threshold of the Free System Page Table Entries counter.
This indicates the number of page table entries not currently in use by the system. If the number is less
than 5,000, there may well be a memory leak or you running out of memory.
ZABBIX_PASSIVE
perf_counter_en[«\Memory\Free System Page Table Entries»]
Memory
Memory page faults per second
Page Faults/sec is the average number of pages faulted per second. It is measured in number of pages
faulted per second because only one page is faulted in each fault operation, hence this is also equal
to the number of page fault operations. This counter includes both hard faults (those that require
disk access) and soft faults (where the faulted page is found elsewhere in physical memory.) Most
processors can handle large numbers of soft faults without significant consequence. However, hard faults,
which require disk access, can cause significant delays.
ZABBIX_PASSIVE
perf_counter_en[«\Memory\Page Faults/sec»]
Memory
Memory pages per second
This measures the rate at which pages are read from or written to disk to resolve hard page faults.
If the value is greater than 1,000, as a result of excessive paging, there may be a memory leak.
ZABBIX_PASSIVE
perf_counter_en[«\Memory\Pages/sec»]
Memory
Memory pool non-paged
This measures the size, in bytes, of the non-paged pool. This is an area of system memory for objects
that cannot be written to disk but instead must remain in physical memory as long as they are allocated.
There is a possible memory leak if the value is greater than 175MB (or 100MB with the /3GB switch).
A typical Event ID 2019 is recorded in the system event log.
ZABBIX_PASSIVE
perf_counter_en[«\Memory\Pool Nonpaged Bytes»]
Triggers
Name
Description
Expression
Severity
Dependencies and additional info
High memory utilization (><$MEMORY.UTIL.MAX>% for 5m)
The system is running out of free memory.
>
AVERAGE
High swap space usage (less than <$SWAP.PFREE.MIN.WARN>% free)
This trigger is ignored, if there is no swap configured
Depends on:
— High memory utilization (><$MEMORY.UTIL.MAX>% for 5m)
Number of free system page table entries is too low (less <$MEM.PAGE_TABLE_CRIT.MIN>for 5m)
The Memory Free System Page Table Entries is less than <$MEM.PAGE_TABLE_CRIT.MIN>for 5 minutes. If the number is less than 5,000, there may well be a memory leak.
Depends on:
— High memory utilization (><$MEMORY.UTIL.MAX>% for 5m)
The Memory Pages/sec is too high (over <$MEM.PAGE_SEC.CRIT.MAX>for 5m)
The Memory Pages/sec in the last 5 minutes exceeds <$MEM.PAGE_SEC.CRIT.MAX>. If the value is greater than 1,000, as a result of excessive paging, there may be a memory leak.
Depends on:
— High memory utilization (><$MEMORY.UTIL.MAX>% for 5m)
Feedback
Please report any issues with the template at https://support.zabbix.com
Windows filesystems by Zabbix agent
Overview
For Zabbix version: 5.4 and higher
Setup
Refer to the vendor documentation.
Zabbix configuration
No specific Zabbix configuration is required.
Macros used
This macro is used in filesystems discovery. Can be overridden on the host or linked template level.
This macro is used in filesystems discovery. Can be overridden on the host or linked template level.
This macro is used in filesystems discovery. Can be overridden on the host or linked template level.
This macro is used in filesystems discovery. Can be overridden on the host or linked template level.
This macro is used in filesystems discovery. Can be overridden on the host or linked template level.
This macro is used in filesystems discovery. Can be overridden on the host or linked template level.
The critical threshold of the filesystem utilization in percent.
The warning threshold of the filesystem utilization in percent.
Template links
There are no template links in this template.
Discovery rules
Name
Description
Type
Key and additional info
Mounted filesystem discovery
Discovery of file systems of different types.
ZABBIX_PASSIVE
vfs.fs.discovery
Filter:
Items collected
Group
Name
Description
Type
Key and additional info
Filesystems
<#FSNAME>: Used space
Used storage in Bytes
ZABBIX_PASSIVE
vfs.fs.size[<#FSNAME>,used]
Filesystems
<#FSNAME>: Total space
Total space in Bytes
ZABBIX_PASSIVE
vfs.fs.size[<#FSNAME>,total]
Filesystems
<#FSNAME>: Space utilization
Space utilization in % for
ZABBIX_PASSIVE
vfs.fs.size[<#FSNAME>,pused]
Triggers
Name
Description
Expression
Severity
Dependencies and additional info
<#FSNAME>: Disk space is critically low (used > <$VFS.FS.PUSED.MAX.CRIT:"<#FSNAME>«>%)
Two conditions should match: First, space utilization should be above <$VFS.FS.PUSED.MAX.CRIT:"<#FSNAME>«>.
Second condition should be one of the following:
— The disk free space is less than 5G.
— The disk will be full in less than 24 hours.
,pused].last()>><$VFS.FS.PUSED.MAX.CRIT:"<#FSNAME>«> and ((,total].last()>-,used].last()>)
AVERAGE
Manual close: YES
Two conditions should match: First, space utilization should be above <$VFS.FS.PUSED.MAX.WARN:"<#FSNAME>«>.
Second condition should be one of the following:
— The disk free space is less than 10G.
— The disk will be full in less than 24 hours.
,pused].last()>><$VFS.FS.PUSED.MAX.WARN:"<#FSNAME>«> and ((,total].last()>-,used].last()>)
WARNING
Manual close: YES
Depends on:
Feedback
Please report any issues with the template at https://support.zabbix.com
Windows physical disks by Zabbix agent
Overview
For Zabbix version: 5.4 and higher
Setup
Refer to the vendor documentation.
Zabbix configuration
No specific Zabbix configuration is required.
Macros used
This macro is used in physical disks discovery. Can be overridden on the host or linked template level.
This macro is used in physical disks discovery. Can be overridden on the host or linked template level.
Disk read average response time (in s) before the trigger would fire.
The warning threshold of disk time utilization in percent.
Disk write average response time (in s) before the trigger would fire.
Current average disk queue, the number of requests outstanding on the disk at the time the performance data is collected.
ZABBIX_PASSIVE
perf_counter_en[«\PhysicalDisk(<#DEVNAME>)\Current Disk Queue Length»,60]
Storage
<#DEVNAME>: Disk utilization
This item is the percentage of elapsed time that the selected disk drive was busy servicing read or writes requests.
ZABBIX_PASSIVE
perf_counter_en[«\PhysicalDisk(<#DEVNAME>)\% Disk Time»,60]
Storage
<#DEVNAME>: Disk read request avg waiting time
The average time for read requests issued to the device to be served. This includes the time spent by the requests in queue and the time spent servicing them.
ZABBIX_PASSIVE
perf_counter_en[«\PhysicalDisk(<#DEVNAME>)\Avg. Disk sec/Read»,60]
Storage
<#DEVNAME>: Disk write request avg waiting time
The average time for write requests issued to the device to be served. This includes the time spent by the requests in queue and the time spent servicing them.
ZABBIX_PASSIVE
perf_counter_en[«\PhysicalDisk(<#DEVNAME>)\Avg. Disk sec/Write»,60]
Storage
<#DEVNAME>: Average disk read queue length
Average disk read queue, the number of requests outstanding on the disk at the time the performance data is collected.
ZABBIX_PASSIVE
perf_counter_en[«\PhysicalDisk(<#DEVNAME>)\Avg. Disk Read Queue Length»,60]
Storage
<#DEVNAME>: Average disk write queue length
Average disk write queue, the number of requests outstanding on the disk at the time the performance data is collected.
ZABBIX_PASSIVE
perf_counter_en[«\PhysicalDisk(<#DEVNAME>)\Avg. Disk Write Queue Length»,60]
Triggers
Name
Description
Expression
Severity
Dependencies and additional info
<#DEVNAME>: Disk is overloaded (util > <$VFS.DEV.UTIL.MAX.WARN>% for 15m)
The disk appears to be under heavy load
Manual close: YES
Depends on:
— <#DEVNAME>: Disk read request responses are too high (read > <$VFS.DEV.READ.AWAIT.WARN:"<#DEVNAME>«>s for 15m
— <#DEVNAME>: Disk write request responses are too high (write > <$VFS.DEV.WRITE.AWAIT.WARN:"<#DEVNAME>«>s for 15m)
<#DEVNAME>: Disk read request responses are too high (read > <$VFS.DEV.READ.AWAIT.WARN:"<#DEVNAME>«>s for 15m
This trigger might indicate disk <#DEVNAME>saturation.
)\Avg. Disk sec/Read»,60].min(15m)> > <$VFS.DEV.READ.AWAIT.WARN:"<#DEVNAME>«>
WARNING
Manual close: YES
<#DEVNAME>: Disk write request responses are too high (write > <$VFS.DEV.WRITE.AWAIT.WARN:"<#DEVNAME>«>s for 15m)
This trigger might indicate disk <#DEVNAME>saturation.
)\Avg. Disk sec/Write»,60].min(15m)> > <$VFS.DEV.WRITE.AWAIT.WARN:"<#DEVNAME>«>
WARNING
Manual close: YES
Feedback
Please report any issues with the template at https://support.zabbix.com
Windows generic by Zabbix agent
Overview
For Zabbix version: 5.4 and higher
Setup
Refer to the vendor documentation.
Zabbix configuration
No specific Zabbix configuration is required.
Macros used
The threshold for difference of system time in seconds.
Template links
There are no template links in this template.
Discovery rules
Items collected
Group
Name
Description
Type
Key and additional info
General
System local time
System local time of the host.
ZABBIX_PASSIVE
system.localtime
General
System name
System host name.
ZABBIX_PASSIVE
system.hostname
Preprocessing:
System description of the host.
ZABBIX_PASSIVE
system.uname
Preprocessing:
The number of processes.
ZABBIX_PASSIVE
proc.num[]
General
Number of threads
The number of threads used by all running processes.
ZABBIX_PASSIVE
perf_counter_en[«\System\Threads»]
Inventory
Operating system architecture
Operating system architecture of the host.
ZABBIX_PASSIVE
system.sw.arch
Preprocessing:
System uptime in ‘N days, hh:mm:ss’ format.
ZABBIX_PASSIVE
system.uptime
Triggers
Name
Description
Expression
Severity
Dependencies and additional info
System time is out of sync (diff with Zabbix server > <$SYSTEM.FUZZYTIME.MAX>s)
The host system time is different from the Zabbix server time.
Manual close: YES
System name has changed (new name: )
System name has changed. Ack to close.
Manual close: YES
Host has been restarted (uptime
WARNING
Manual close: YES
Feedback
Please report any issues with the template at https://support.zabbix.com
Windows network by Zabbix agent
Overview
For Zabbix version: 5.4 and higher
Setup
Refer to the vendor documentation.
Zabbix configuration
No specific Zabbix configuration is required.
Macros used
This macro is used in Network interface discovery. Can be overridden on the host or linked template level.
This macro is used in Network interface discovery. Can be overridden on the host or linked template level.
This macro is used in Network interface discovery. Can be overridden on the host or linked template level.
This macro is used in Network interface discovery. Can be overridden on the host or linked template level.
This macro is used in Network interface discovery. Can be overridden on the host or linked template level.
This macro is used in Network interface discovery. Can be overridden on the host or linked template level.
wmi.getall[root\cimv2,»select Name,Description,NetConnectionID,Speed,AdapterTypeId,NetConnectionStatus from win32_networkadapter where PhysicalAdapter=True and NetConnectionStatus>0″]
Triggers
Name
Description
Expression
Severity
Dependencies and additional info
Interface <#IFNAME>(<#IFALIAS>): High bandwidth usage (> <$IF.UTIL.MAX:"<#IFNAME>«>% )
The network interface utilization is close to its estimated maximum bandwidth.
(«].avg(15m)>>(<$IF.UTIL.MAX:"<#IFNAME>«>/100)*«].last()> or «].avg(15m)>>(<$IF.UTIL.MAX:"<#IFNAME>«>/100)*«].last()>) and «].last()>>0
«].avg(15m)>
WARNING
Manual close: YES
Depends on:
Interface <#IFNAME>(<#IFALIAS>): High error rate (> <$IF.ERRORS.WARN:"<#IFNAME>«> for 5m)
Recovers when below 80% of <$IF.ERRORS.WARN:"<#IFNAME>«> threshold
«,errors].min(5m)>><$IF.ERRORS.WARN:"<#IFNAME>«> or «,errors].min(5m)>><$IF.ERRORS.WARN:"<#IFNAME>«>
«,errors].max(5m)>
WARNING
Manual close: YES
Depends on:
Interface <#IFNAME>(<#IFALIAS>): Ethernet has changed to lower speed than it was before
This Ethernet connection has transitioned down from its known maximum speed. This might be a sign of autonegotiation issues. Ack to close.
Manual close: YES
Depends on:
This trigger expression works as follows:
1. Can be triggered if operations status is down.
2. <$IFCONTROL:\"<#IFNAME>\»>=1 — user can redefine Context macro to value — 0. That marks this interface as not important.
No new trigger will be fired if this interface is down.
3. =1) — trigger fires only if operational status is different from Connected(2).
WARNING: if closed manually — won’t fire again on next poll, because of .diff.
<$IFCONTROL:"<#IFNAME>«>=1 and («].last()><>2 and «].diff()>=1)
«].last()>=2 or <$IFCONTROL:"<#IFNAME>«>=0
AVERAGE
Manual close: YES
Feedback
Please report any issues with the template at https://support.zabbix.com
Windows services by Zabbix agent
Overview
For Zabbix version: 5.4 and higher Special version of services template that is required for Windows OS.
Setup
Refer to the vendor documentation.
Zabbix configuration
No specific Zabbix configuration is required.
Macros used
This macro is used in Service discovery. Can be overridden on the host or linked template level.
This macro is used in Service discovery. Can be overridden on the host or linked template level.
Context Switches/sec is the combined rate at which all processors on the computer are switched from one thread to another.
Context switches occur when a running thread voluntarily relinquishes the processor, is preempted by a higher priority ready thread, or switches between user-mode and privileged (kernel) mode to use an Executive or subsystem service.
It is the sum of Thread\Context Switches/sec for all threads running on all processors in the computer and is measured in numbers of switches.
There are context switch counters on the System and Thread objects. This counter displays the difference between the values observed in the last two samples, divided by the duration of the sample interval.
ZABBIX_ACTIVE
perf_counter_en[«\System\Context Switches/sec»]
CPU
CPU privileged time
The Processor Information\% Privileged Time counter shows the percent of time that the processor is spent
executing in Kernel (or Privileged) mode. Privileged mode includes services interrupts inside Interrupt
Service Routines (ISRs), executing Deferred Procedure Calls (DPCs), Device Driver calls and other kernel-mode
The Processor Information\% User Time counter shows the percent of time that the processor(s) is spent executing
ZABBIX_ACTIVE
perf_counter_en[«\Processor Information(_total)\% User Time»]
CPU
Number of cores
The number of logical processors available on the computer.
ZABBIX_ACTIVE
wmi.get[root/cimv2,»Select NumberOfLogicalProcessors from Win32_ComputerSystem»]
CPU
CPU queue length
The Processor Queue Length shows the number of threads that are observed as delayed in the processor Ready Queue
and are waiting to be executed.
ZABBIX_ACTIVE
perf_counter_en[«\System\Processor Queue Length»]
Triggers
Name
Description
Expression
Severity
Dependencies and additional info
High CPU utilization (over <$CPU.UTIL.CRIT>% for 5m)
CPU utilization is too high. The system might be slow to respond.
>
WARNING
CPU interrupt time is too high (over <$CPU.INTERRUPT.CRIT.MAX>% for 5m)
«The CPU Interrupt Time in the last 5 minutes exceeds <$CPU.INTERRUPT.CRIT.MAX>%.»
The Processor Information\% Interrupt Time is the time the processor spends receiving and servicing
hardware interrupts during sample intervals. This value is an indirect indicator of the activity of
devices that generate interrupts, such as the system clock, the mouse, disk drivers, data communication
lines, network interface cards and other peripheral devices. This is an easy way to identify a potential
hardware failure. This should never be higher than 20%.
Depends on:
— High CPU utilization (over <$CPU.UTIL.CRIT>% for 5m)
CPU privileged time is too high (over <$CPU.PRIV.CRIT.MAX>% for 5m)
The CPU privileged time in the last 5 minutes exceeds <$CPU.PRIV.CRIT.MAX>%.
Depends on:
— CPU interrupt time is too high (over <$CPU.INTERRUPT.CRIT.MAX>% for 5m)
— High CPU utilization (over <$CPU.UTIL.CRIT>% for 5m)
CPU queue length is too high (over <$CPU.QUEUE.CRIT.MAX>for 5m)
The CPU Queue Length in the last 5 minutes exceeds <$CPU.QUEUE.CRIT.MAX>. According to actual observations, PQL should not exceed the number of cores * 2. To fine-tune the conditions, use the macro <$CPU.QUEUE.CRIT.MAX >.
Depends on:
— High CPU utilization (over <$CPU.UTIL.CRIT>% for 5m)
Feedback
Please report any issues with the template at https://support.zabbix.com
Windows memory by Zabbix agent active
Overview
For Zabbix version: 5.4 and higher
Setup
Refer to the vendor documentation.
Zabbix configuration
No specific Zabbix configuration is required.
Macros used
The warning threshold of the Memory Pages/sec counter.
The warning threshold of the Free System Page Table Entries counter.
This indicates the number of page table entries not currently in use by the system. If the number is less
than 5,000, there may well be a memory leak or you running out of memory.
ZABBIX_ACTIVE
perf_counter_en[«\Memory\Free System Page Table Entries»]
Memory
Memory page faults per second
Page Faults/sec is the average number of pages faulted per second. It is measured in number of pages
faulted per second because only one page is faulted in each fault operation, hence this is also equal
to the number of page fault operations. This counter includes both hard faults (those that require
disk access) and soft faults (where the faulted page is found elsewhere in physical memory.) Most
processors can handle large numbers of soft faults without significant consequence. However, hard faults,
which require disk access, can cause significant delays.
ZABBIX_ACTIVE
perf_counter_en[«\Memory\Page Faults/sec»]
Memory
Memory pages per second
This measures the rate at which pages are read from or written to disk to resolve hard page faults.
If the value is greater than 1,000, as a result of excessive paging, there may be a memory leak.
ZABBIX_ACTIVE
perf_counter_en[«\Memory\Pages/sec»]
Memory
Memory pool non-paged
This measures the size, in bytes, of the non-paged pool. This is an area of system memory for objects
that cannot be written to disk but instead must remain in physical memory as long as they are allocated.
There is a possible memory leak if the value is greater than 175MB (or 100MB with the /3GB switch).
A typical Event ID 2019 is recorded in the system event log.
ZABBIX_ACTIVE
perf_counter_en[«\Memory\Pool Nonpaged Bytes»]
Triggers
Name
Description
Expression
Severity
Dependencies and additional info
High memory utilization (><$MEMORY.UTIL.MAX>% for 5m)
The system is running out of free memory.
>
AVERAGE
High swap space usage (less than <$SWAP.PFREE.MIN.WARN>% free)
This trigger is ignored, if there is no swap configured
Depends on:
— High memory utilization (><$MEMORY.UTIL.MAX>% for 5m)
Number of free system page table entries is too low (less <$MEM.PAGE_TABLE_CRIT.MIN>for 5m)
The Memory Free System Page Table Entries is less than <$MEM.PAGE_TABLE_CRIT.MIN>for 5 minutes. If the number is less than 5,000, there may well be a memory leak.
Depends on:
— High memory utilization (><$MEMORY.UTIL.MAX>% for 5m)
The Memory Pages/sec is too high (over <$MEM.PAGE_SEC.CRIT.MAX>for 5m)
The Memory Pages/sec in the last 5 minutes exceeds <$MEM.PAGE_SEC.CRIT.MAX>. If the value is greater than 1,000, as a result of excessive paging, there may be a memory leak.
Depends on:
— High memory utilization (><$MEMORY.UTIL.MAX>% for 5m)
Feedback
Please report any issues with the template at https://support.zabbix.com
Windows filesystems by Zabbix agent active
Overview
For Zabbix version: 5.4 and higher
Setup
Refer to the vendor documentation.
Zabbix configuration
No specific Zabbix configuration is required.
Macros used
This macro is used in filesystems discovery. Can be overridden on the host or linked template level.
This macro is used in filesystems discovery. Can be overridden on the host or linked template level.
This macro is used in filesystems discovery. Can be overridden on the host or linked template level.
This macro is used in filesystems discovery. Can be overridden on the host or linked template level.
This macro is used in filesystems discovery. Can be overridden on the host or linked template level.
This macro is used in filesystems discovery. Can be overridden on the host or linked template level.
The critical threshold of the filesystem utilization in percent.
The warning threshold of the filesystem utilization in percent.
Template links
There are no template links in this template.
Discovery rules
Name
Description
Type
Key and additional info
Mounted filesystem discovery
Discovery of file systems of different types.
ZABBIX_ACTIVE
vfs.fs.discovery
Filter:
Items collected
Group
Name
Description
Type
Key and additional info
Filesystems
<#FSNAME>: Used space
Used storage in Bytes
ZABBIX_ACTIVE
vfs.fs.size[<#FSNAME>,used]
Filesystems
<#FSNAME>: Total space
Total space in Bytes
ZABBIX_ACTIVE
vfs.fs.size[<#FSNAME>,total]
Filesystems
<#FSNAME>: Space utilization
Space utilization in % for
ZABBIX_ACTIVE
vfs.fs.size[<#FSNAME>,pused]
Triggers
Name
Description
Expression
Severity
Dependencies and additional info
<#FSNAME>: Disk space is critically low (used > <$VFS.FS.PUSED.MAX.CRIT:"<#FSNAME>«>%)
Two conditions should match: First, space utilization should be above <$VFS.FS.PUSED.MAX.CRIT:"<#FSNAME>«>.
Second condition should be one of the following:
— The disk free space is less than 5G.
— The disk will be full in less than 24 hours.
,pused].last()>><$VFS.FS.PUSED.MAX.CRIT:"<#FSNAME>«> and ((,total].last()>-,used].last()>)
AVERAGE
Manual close: YES
Two conditions should match: First, space utilization should be above <$VFS.FS.PUSED.MAX.WARN:"<#FSNAME>«>.
Second condition should be one of the following:
— The disk free space is less than 10G.
— The disk will be full in less than 24 hours.
,pused].last()>><$VFS.FS.PUSED.MAX.WARN:"<#FSNAME>«> and ((,total].last()>-,used].last()>)
WARNING
Manual close: YES
Depends on:
Feedback
Please report any issues with the template at https://support.zabbix.com
Windows physical disks by Zabbix agent active
Overview
For Zabbix version: 5.4 and higher
Setup
Refer to the vendor documentation.
Zabbix configuration
No specific Zabbix configuration is required.
Macros used
This macro is used in physical disks discovery. Can be overridden on the host or linked template level.
This macro is used in physical disks discovery. Can be overridden on the host or linked template level.
Disk read average response time (in s) before the trigger would fire.
The warning threshold of disk time utilization in percent.
Disk write average response time (in s) before the trigger would fire.
Current average disk queue, the number of requests outstanding on the disk at the time the performance data is collected.
ZABBIX_ACTIVE
perf_counter_en[«\PhysicalDisk(<#DEVNAME>)\Current Disk Queue Length»,60]
Storage
<#DEVNAME>: Disk utilization
This item is the percentage of elapsed time that the selected disk drive was busy servicing read or writes requests.
ZABBIX_ACTIVE
perf_counter_en[«\PhysicalDisk(<#DEVNAME>)\% Disk Time»,60]
Storage
<#DEVNAME>: Disk read request avg waiting time
The average time for read requests issued to the device to be served. This includes the time spent by the requests in queue and the time spent servicing them.
ZABBIX_ACTIVE
perf_counter_en[«\PhysicalDisk(<#DEVNAME>)\Avg. Disk sec/Read»,60]
Storage
<#DEVNAME>: Disk write request avg waiting time
The average time for write requests issued to the device to be served. This includes the time spent by the requests in queue and the time spent servicing them.
ZABBIX_ACTIVE
perf_counter_en[«\PhysicalDisk(<#DEVNAME>)\Avg. Disk sec/Write»,60]
Storage
<#DEVNAME>: Average disk read queue length
Average disk read queue, the number of requests outstanding on the disk at the time the performance data is collected.
ZABBIX_ACTIVE
perf_counter_en[«\PhysicalDisk(<#DEVNAME>)\Avg. Disk Read Queue Length»,60]
Storage
<#DEVNAME>: Average disk write queue length
Average disk write queue, the number of requests outstanding on the disk at the time the performance data is collected.
ZABBIX_ACTIVE
perf_counter_en[«\PhysicalDisk(<#DEVNAME>)\Avg. Disk Write Queue Length»,60]
Triggers
Name
Description
Expression
Severity
Dependencies and additional info
<#DEVNAME>: Disk is overloaded (util > <$VFS.DEV.UTIL.MAX.WARN>% for 15m)
The disk appears to be under heavy load
Manual close: YES
Depends on:
— <#DEVNAME>: Disk read request responses are too high (read > <$VFS.DEV.READ.AWAIT.WARN:"<#DEVNAME>«>s for 15m
— <#DEVNAME>: Disk write request responses are too high (write > <$VFS.DEV.WRITE.AWAIT.WARN:"<#DEVNAME>«>s for 15m)
<#DEVNAME>: Disk read request responses are too high (read > <$VFS.DEV.READ.AWAIT.WARN:"<#DEVNAME>«>s for 15m
This trigger might indicate disk <#DEVNAME>saturation.
)\Avg. Disk sec/Read»,60].min(15m)> > <$VFS.DEV.READ.AWAIT.WARN:"<#DEVNAME>«>
WARNING
Manual close: YES
<#DEVNAME>: Disk write request responses are too high (write > <$VFS.DEV.WRITE.AWAIT.WARN:"<#DEVNAME>«>s for 15m)
This trigger might indicate disk <#DEVNAME>saturation.
)\Avg. Disk sec/Write»,60].min(15m)> > <$VFS.DEV.WRITE.AWAIT.WARN:"<#DEVNAME>«>
WARNING
Manual close: YES
Feedback
Please report any issues with the template at https://support.zabbix.com
Windows generic by Zabbix agent active
Overview
For Zabbix version: 5.4 and higher
Setup
Refer to the vendor documentation.
Zabbix configuration
No specific Zabbix configuration is required.
Macros used
The threshold for difference of system time in seconds.
Template links
There are no template links in this template.
Discovery rules
Items collected
Group
Name
Description
Type
Key and additional info
General
System local time
System local time of the host.
ZABBIX_ACTIVE
system.localtime
General
System name
System host name.
ZABBIX_ACTIVE
system.hostname
Preprocessing:
System description of the host.
ZABBIX_ACTIVE
system.uname
Preprocessing:
The number of processes.
ZABBIX_ACTIVE
proc.num[]
General
Number of threads
The number of threads used by all running processes.
ZABBIX_ACTIVE
perf_counter_en[«\System\Threads»]
Inventory
Operating system architecture
Operating system architecture of the host.
ZABBIX_ACTIVE
system.sw.arch
Preprocessing:
System uptime in ‘N days, hh:mm:ss’ format.
ZABBIX_ACTIVE
system.uptime
Triggers
Name
Description
Expression
Severity
Dependencies and additional info
System time is out of sync (diff with Zabbix server > <$SYSTEM.FUZZYTIME.MAX>s)
The host system time is different from the Zabbix server time.
Manual close: YES
System name has changed (new name: )
System name has changed. Ack to close.
Manual close: YES
Host has been restarted (uptime
WARNING
Manual close: YES
Feedback
Please report any issues with the template at https://support.zabbix.com
Windows network by Zabbix agent active
Overview
For Zabbix version: 5.4 and higher
Setup
Refer to the vendor documentation.
Zabbix configuration
No specific Zabbix configuration is required.
Macros used
This macro is used in Network interface discovery. Can be overridden on the host or linked template level.
This macro is used in Network interface discovery. Can be overridden on the host or linked template level.
This macro is used in Network interface discovery. Can be overridden on the host or linked template level.
This macro is used in Network interface discovery. Can be overridden on the host or linked template level.
This macro is used in Network interface discovery. Can be overridden on the host or linked template level.
This macro is used in Network interface discovery. Can be overridden on the host or linked template level.
wmi.getall[root\cimv2,»select Name,Description,NetConnectionID,Speed,AdapterTypeId,NetConnectionStatus from win32_networkadapter where PhysicalAdapter=True and NetConnectionStatus>0″]
Triggers
Name
Description
Expression
Severity
Dependencies and additional info
Interface <#IFNAME>(<#IFALIAS>): High bandwidth usage (> <$IF.UTIL.MAX:"<#IFNAME>«>% )
The network interface utilization is close to its estimated maximum bandwidth.
(«].avg(15m)>>(<$IF.UTIL.MAX:"<#IFNAME>«>/100)*«].last()> or «].avg(15m)>>(<$IF.UTIL.MAX:"<#IFNAME>«>/100)*«].last()>) and «].last()>>0
«].avg(15m)>
WARNING
Manual close: YES
Depends on:
Interface <#IFNAME>(<#IFALIAS>): High error rate (> <$IF.ERRORS.WARN:"<#IFNAME>«> for 5m)
Recovers when below 80% of <$IF.ERRORS.WARN:"<#IFNAME>«> threshold
«,errors].min(5m)>><$IF.ERRORS.WARN:"<#IFNAME>«> or «,errors].min(5m)>><$IF.ERRORS.WARN:"<#IFNAME>«>
«,errors].max(5m)>
WARNING
Manual close: YES
Depends on:
Interface <#IFNAME>(<#IFALIAS>): Ethernet has changed to lower speed than it was before
This Ethernet connection has transitioned down from its known maximum speed. This might be a sign of autonegotiation issues. Ack to close.
Manual close: YES
Depends on:
This trigger expression works as follows:
1. Can be triggered if operations status is down.
2. <$IFCONTROL:\"<#IFNAME>\»>=1 — user can redefine Context macro to value — 0. That marks this interface as not important.
No new trigger will be fired if this interface is down.
3. =1) — trigger fires only if operational status is different from Connected(2).
WARNING: if closed manually — won’t fire again on next poll, because of .diff.
<$IFCONTROL:"<#IFNAME>«>=1 and («].last()><>2 and «].diff()>=1)
«].last()>=2 or <$IFCONTROL:"<#IFNAME>«>=0
AVERAGE
Manual close: YES
Feedback
Please report any issues with the template at https://support.zabbix.com
Windows services by Zabbix agent active
Overview
For Zabbix version: 5.4 and higher Special version of services template that is required for Windows OS.
Setup
Refer to the vendor documentation.
Zabbix configuration
No specific Zabbix configuration is required.
Macros used
This macro is used in Service discovery. Can be overridden on the host or linked template level.
This macro is used in Service discovery. Can be overridden on the host or linked template level.
This macro is used in Service discovery. Can be overridden on the host or linked template level.
This macro is used in Service discovery. Can be overridden on the host or linked template level.
^manual|disabled$
Template links
There are no template links in this template.
Discovery rules
Name
Description
Type
Key and additional info
Windows services discovery
Discovery of Windows services of different types as defined in template’s macros.
ZABBIX_ACTIVE
service.discovery
Filter:
Items collected
Group
Name
Description
Type
Key and additional info
Services
State of service «<#SERVICE.NAME>» (<#SERVICE.DISPLAYNAME>)
ZABBIX_ACTIVE
service.info[«<#SERVICE.NAME>«,state]
Triggers
Name
Description
Expression
Severity
Dependencies and additional info
«<#SERVICE.NAME>» (<#SERVICE.DISPLAYNAME>) is not running (startup type <#SERVICE.STARTUPNAME>)
The service has a state other than «Running» for the last three times.
«,state].min(#3)><>0
AVERAGE
Feedback
Please report any issues with the template at https://support.zabbix.com
Windows by Zabbix agent active
Overview
For Zabbix version: 5.4 and higher New official Windows template. Requires agent of Zabbix 4.4 and newer.
This template was tested on:
Windows, version 7 and newer.
Windows Server, version 2008 R2 and newer.
Setup
Install Zabbix agent on Windows OS according to Zabbix documentation.
Zabbix configuration
No specific Zabbix configuration is required.
Template links
Name
Windows CPU by Zabbix agent active
Windows filesystems by Zabbix agent active
Windows generic by Zabbix agent active
Windows memory by Zabbix agent active
Windows network by Zabbix agent active
Windows physical disks by Zabbix agent active
Windows services by Zabbix agent active
Zabbix agent
Discovery rules
Items collected
Group
Name
Description
Type
Key and additional info
Triggers
Name
Description
Expression
Severity
Dependencies and additional info
Feedback
Please report any issues with the template at https://support.zabbix.com
You can also provide a feedback, discuss the template or ask for help with it at ZABBIX forums.
Windows SNMP
Overview
For Zabbix version: 5.2 and higher
Setup
Refer to the vendor documentation.
Zabbix configuration
No specific Zabbix configuration is required.
Template links
Name
Generic SNMP
HOST-RESOURCES-MIB SNMP
Interfaces Windows SNMP
Discovery rules
Items collected
Group
Name
Description
Type
Key and additional info
Triggers
Name
Description
Expression
Severity
Dependencies and additional info
Feedback
Please report any issues with the template at https://support.zabbix.com
Known Issues
Description: Doesn’t support In/Out 64 bit counters even though IfxTable is present: Currently, Windows gets it’s interface status from MIB-2. Since these 64bit SNMP counters (ifHCInOctets, ifHCOutOctets, etc.) are defined as an extension to IF-MIB, Microsoft has not implemented it. https://social.technet.microsoft.com/Forums/windowsserver/en-US/07b62ff0-94f6-40ca-a99d-d129c1b33d70/windows-2008-r2-snmp-64bit-counters-support?forum=winservergen